Six Psychology Principles Behind Spotify Wrapped
 +20 XP
Case study
Six Psychology Principles Behind Spotify Wrapped
Every December, Spotify turns a year of listening into a short story that people rush to post. Walk through Wrapped from the first teaser to the last slide and see the six psychology principles that make it spread, plus one idea for a stronger ending.
+20 XP when you reach the endWhat you will learn
- Build anticipation with a curiosity gap
- Tell data as a story instead of a report
- Design results people are proud to share
Scroll to follow the story. The screen changes with you.
Based on the learnings from Growth.Design: Spotify Wrapped: 6 psychology principles that make it go viral every year, presented in our own format.
Step 1 of 9
- Open question
01
1. Curiosity gap
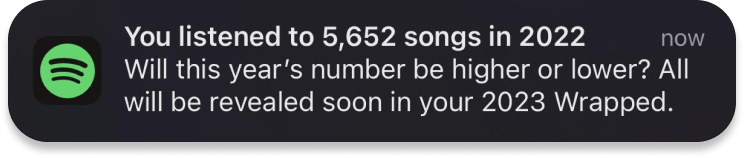
A week before launch, a notification asks: higher or lower than last year?
The push message reminds people they listened to 5,652 songs the year before and asks whether this year's number will beat it. It gives a number and holds back the answer until Wrapped arrives.
TakeawayAn open question with a known payoff date keeps people waiting for it.
Use the emotional sideThe total song count is one hook, but a question about a favorite song would be more personal. It taps into what music represents to people and builds more anticipation.
 Your 2023 Wrapped
02
2. Anticipation
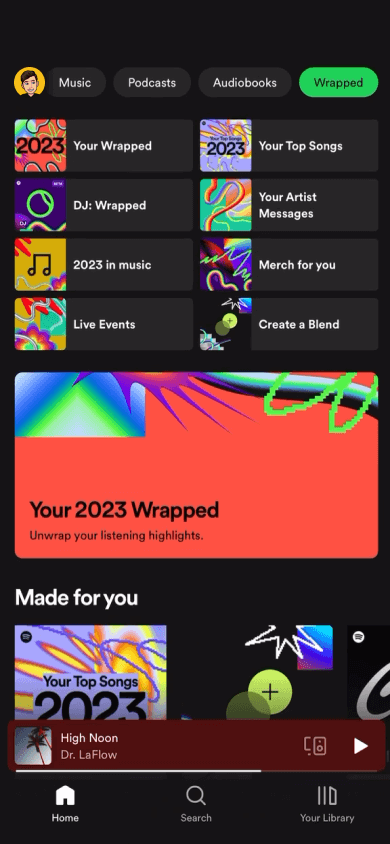
When Wrapped finally lands, it takes over the home screen like an event.
People wonder about their results all year, and some even try to change their listening before December. On release day, a 'Wrapped' tab and a large 'Your 2023 Wrapped' card lead the home screen.
TakeawayA recurring, dated release turns a feature into something people wait for.
Question 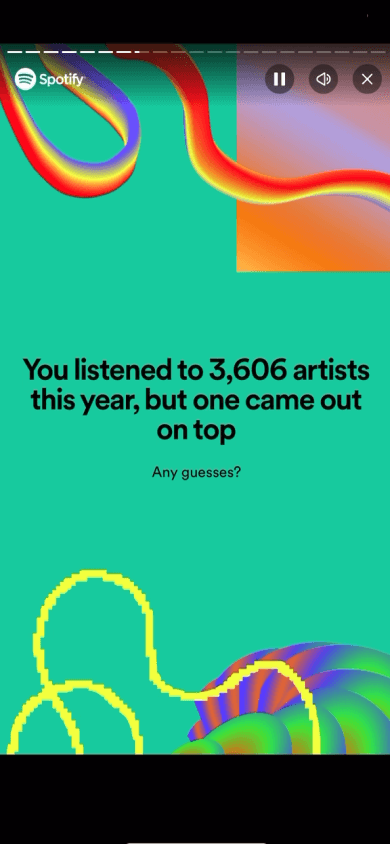 Any guesses?
Answer 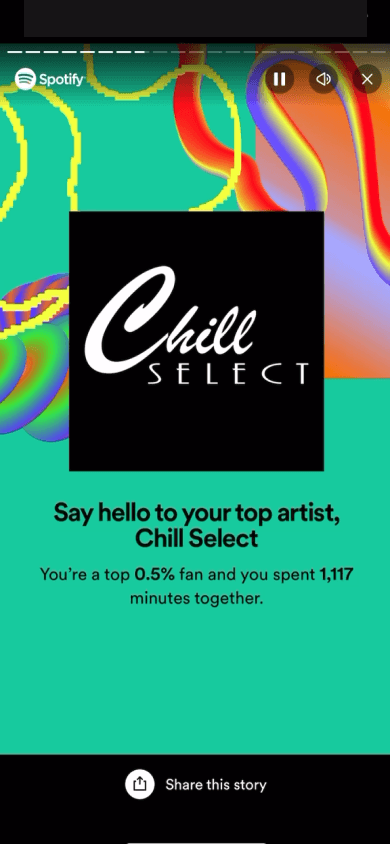 Top 0.5% fan
03
2. Anticipation
One slide asks 'any guesses?', the next reveals the top artist.
'You listened to 3,606 artists this year, but one came out on top' sets up the reveal. The next slide shows the artist and adds a detail that makes it personal: a top 0.5% fan with 1,117 minutes together.
TakeawayPause before the payoff. The wait makes the reveal feel like a reward.
Variable rewardPeople especially enjoy unexpected rewards. Not knowing who your top artists, songs and genres will be is one of the key ingredients of Wrapped's success.
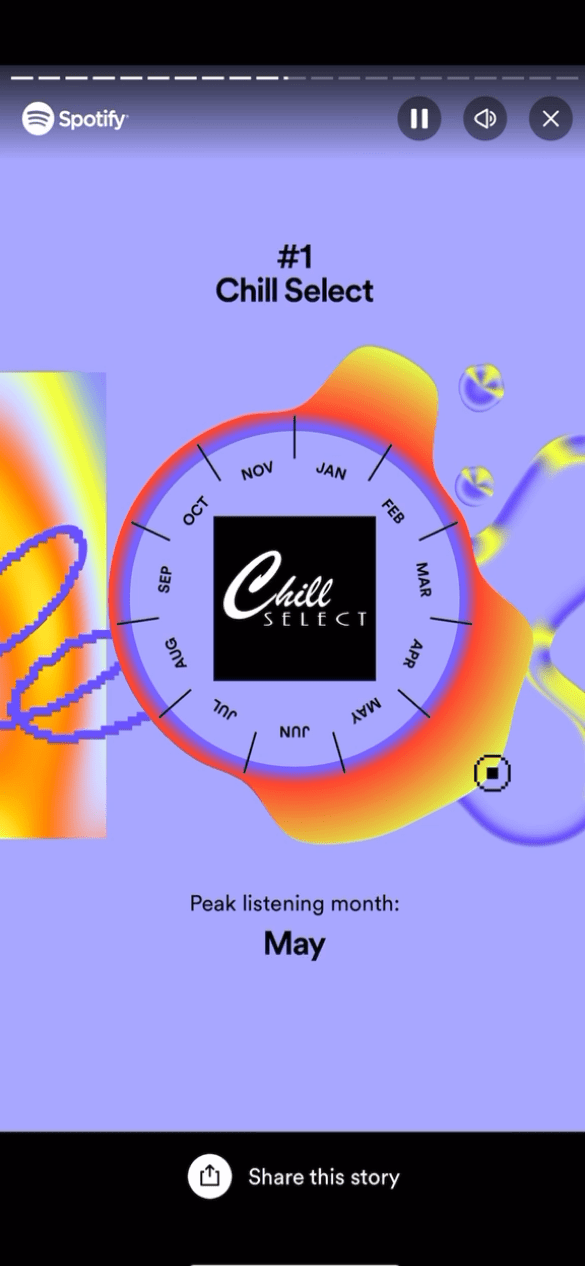 Peak month: May
04
3. Storytelling
Instead of a chart, Wrapped tells the story of your year with each artist.
Spotify could simply send a summary list. Instead each section opens with crafted copy, and a timeline shows the month you listened to each top artist most. It helps people recall the memories they made with that music.
TakeawayFacts are forgotten. The story around them is remembered.
The impact of storytellingStories engage many areas of the brain, which makes them more memorable than facts and statistics alone. Spotify tells the story of how music played a role in the events of people's lives.
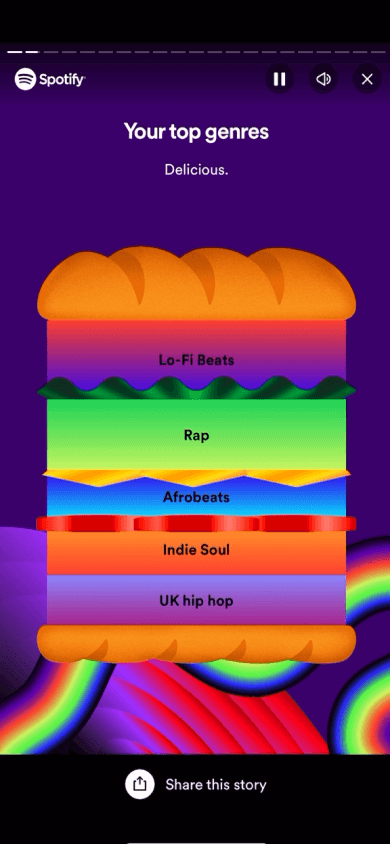 Genre layers
05
4. Delighters
Top genres arrive as a sandwich, one layer for each genre.
Lo-Fi Beats, Rap, Afrobeats, Indie Soul and UK hip hop are stacked into an animated sandwich under the line 'Delicious'. The format is playful and new, which makes the data stick.
TakeawayPeople notice and remember data presented in an unexpected, playful way.
DelightersWrapped arrives with new graphic styles and animated stories every year, using the fact that people remember playful pleasures better.
Total 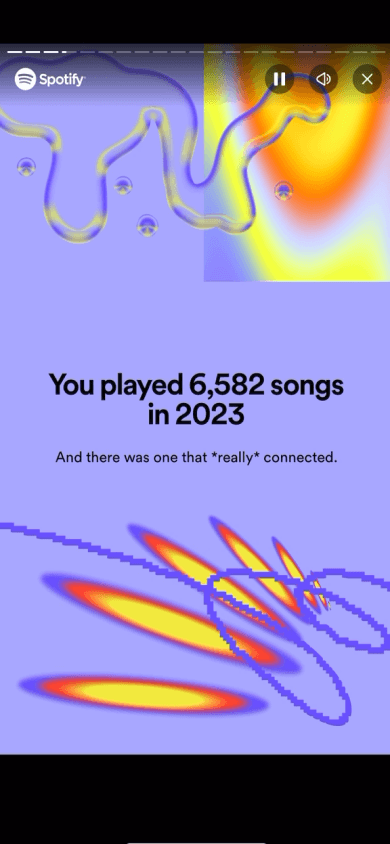 6,582 songs
Peak day 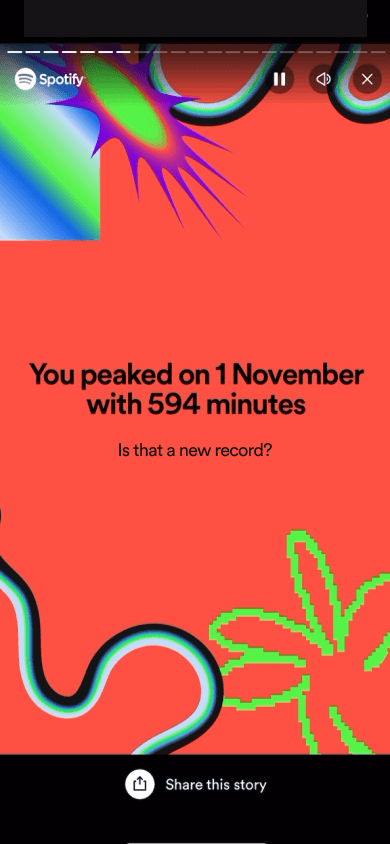 A personal record
06
5. Numbers
Big totals remind people how much value Spotify gave them this year.
'You played 6,582 songs in 2023' and 'You peaked on 1 November with 594 minutes' turn usage into a personal record. The numbers take people back to a particular day and link time spent with a broader music taste.
TakeawayFrame usage as something the user achieved, not time they spent.
FramingBy associating time spent on Spotify with past memories, Spotify frames the data positively. Compare it with how you feel when you see a high number on Screen Time.
 Ready to post
07
6. Social value
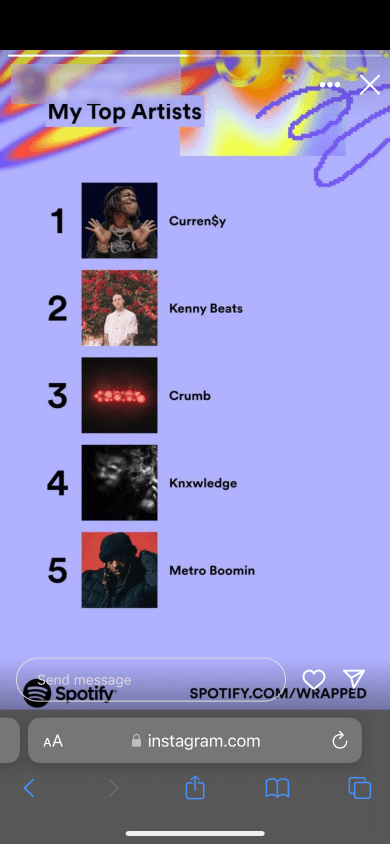
Shareable cards, like 'My Top Artists', flood social feeds.
Every slide has a 'Share this story' button, and summary cards are sized for Instagram Stories. As more people post their results each year, more people want to join in, and a positive experience makes sharing more likely.
TakeawayGive people something that says who they are, and they will share it.
Bandwagon effectWrapped's popularity is helped by the bandwagon effect: people start doing something because everyone else seems to be doing it. Sharing is also a way to be seen for who we are, since music reflects part of our identity.
 Anticlimax
08
A missed moment
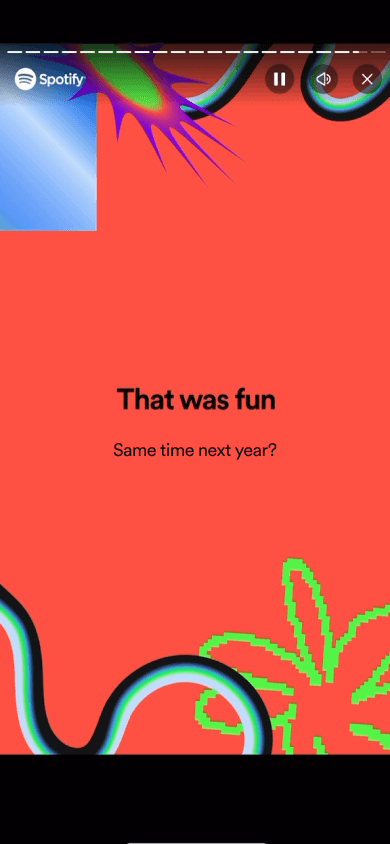
The last slide says 'That was fun. Same time next year?'
It primes people for next year's Wrapped, which is smart. But after a run of reveals, ending on a plain goodbye feels anticlimactic.
TakeawayEnd a sequence with one more reward, not just a sign off.
Original Plain goodbyeSuggested 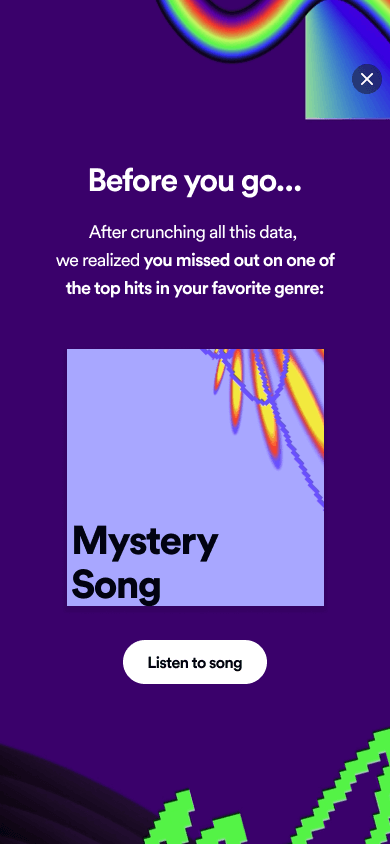 Listen to song
09
The suggestion
Close with a 'Mystery Song' from your favorite genre that you missed.
Growth.Design proposes a final slide: 'Before you go... you missed out on one of the top hits in your favorite genre', with a hidden song and a 'Listen to song' button. It gives people one more reason to keep listening.
What changed
- Personalization: a song picked for the listener
- FOMO: something they missed, not only what they liked
- Singularity effect: one song, not a whole playlist
- Curiosity gap: the song is not revealed right away
TakeawayThe best endings reward people and point them to what to do next.
Every takeaway, in one place
- 1. Curiosity gapAn open question with a known payoff date keeps people waiting for it.
- 2. AnticipationA recurring, dated release turns a feature into something people wait for.
- 2. AnticipationPause before the payoff. The wait makes the reveal feel like a reward.
- 3. StorytellingFacts are forgotten. The story around them is remembered.
- 4. DelightersPeople notice and remember data presented in an unexpected, playful way.
- 5. NumbersFrame usage as something the user achieved, not time they spent.
- 6. Social valueGive people something that says who they are, and they will share it.
- A missed momentEnd a sequence with one more reward, not just a sign off.
- The suggestionThe best endings reward people and point them to what to do next.
Source: Growth.Design: Spotify Wrapped: 6 psychology principles that make it go viral every year
Turn your product data into a moment people share.
Most products sit on data that could tell each customer a story about their own year, progress or results. Zyxware can help you find that story in your data, design a recap people look forward to, and make sharing it feel natural.